Drying of food
Practical Action
Air that is not saturated with water (low RH air) has the capacity to pick up and hold more water
until it becomes saturated. The principle of drying is that dry air comes into contact with food
and absorbs some of the moisture from the food. This air then has to be blown away and be
replaced with dry air so that the process of extracting moisture from the food can continue until
the food is dry. If wet air (with a high RH) is used, ie in tropical climates where it is fairly
humid, it quickly becomes saturated and cannot pick up further water vapour from the food.
The drying process in the humid tropics therefore takes longer than in the semi-arid tropics.
The temperature of the air affects the humidity - higher temperatures reduce the humidity and
allow the air to carry more water vapour. The relationship between temperature and RH is
conveniently shown on a psychrometric chart (see Figure 1).
Note that there are two types of air temperature: the dry bulb and the wet bulb. Both these are
used to assess the humidity of the air at a given temperature.
The temperature of the air, measured by a thermometer bulb, is termed the dry-bulb
temperature. If the thermometer bulb is surrounded by a wet cloth, heat is removed by
evaporation of the water from the cloth and the temperature falls (to the wet bulb temperature).
The difference between the two temperatures is used to find the relative humidity of air on the
psychrometric chart see figures 1 and 2).
The dew point is the temperature at which air becomes saturated with moisture (100% RH). Any
further cooling from this point results in condensation of the water from the air. This is seen at
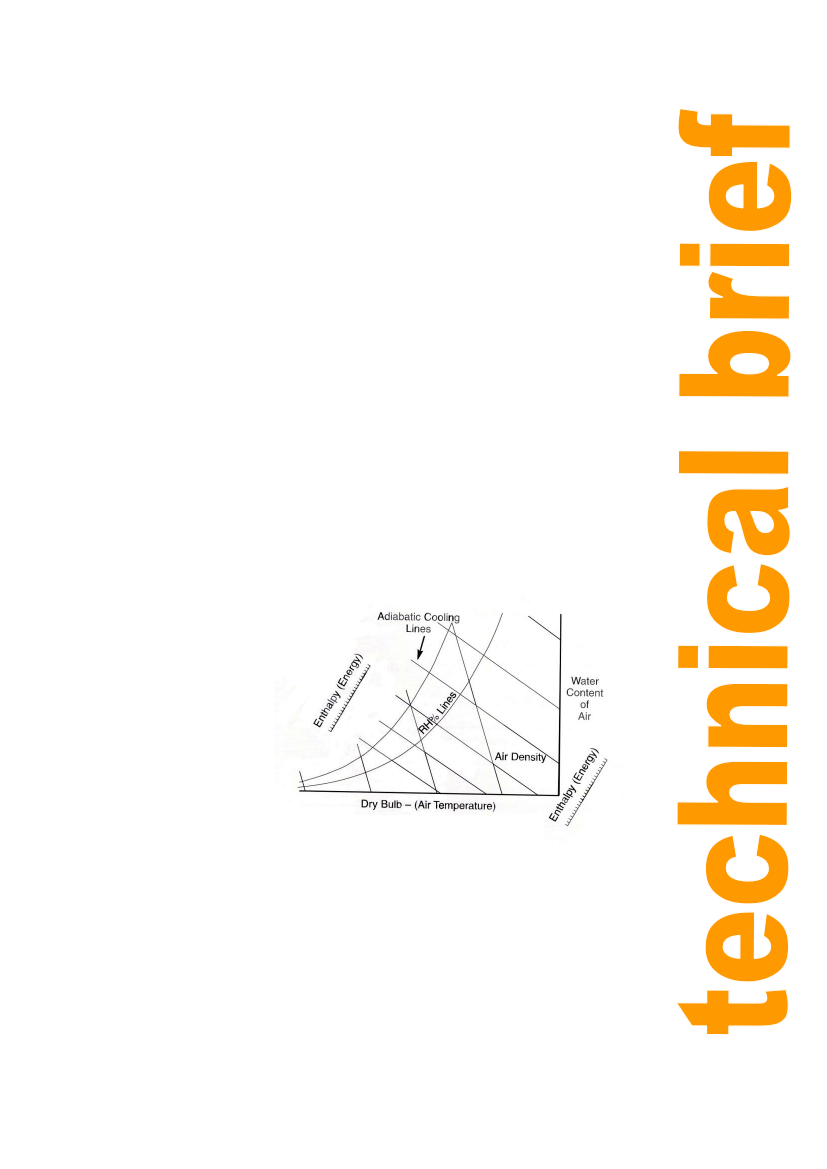
night when air cools and water vapour forms as dew on the ground. Adiabatic cooling lines are
the parallel straight lines sloping across the chart, which show how absolute humidity decreases
as the air temperature increases.
Use of a psychrometric chart
A psychrometric chart is a
graphical combination of the
different characteristics of air
that are important in terms of
drying. The characteristics
included on the chart are the
temperature, absolute
humidity, relative humidity (%)
and air density. The chart has
been developed to help with
drying calculations and with
the design of dryers.
Figure 1 shows a simple
version of a psychrometric
chart while figure 2 has a more
detailed version.
Figure 1: A simple psychrometric chart
The psychrometric chart is used to find the changes to air during drying. From that, the
efficiency of the dryer can be calculated. The following examples show how it is used.
Using Figure 2, find:
1 the absolute humidity of air which has 50% RH and a dry-bulb temperature of 60°C
2 the wet-bulb temperature under these conditions
3 the RH of air having a wet-bulb temperature of 45°C and a dry-bulb temperature of 75°C
4 the dew point of air cooled adiabatically from a dry-bulb temperature of 55°C and 30% RH
5 the change in RH of air with a wet-bulb temperature of 39°C, heated from a dry-bulb
temperature of 50°C to a dry-bulb temperature of 86°C
6 the change in RH of air with a wet-bulb temperature of 35°C, cooled adiabatically from a
dry-bulb temperature of 70°C to 40°C.
2